Meta-analysis: Effect sizes and data

Professor Andy Field

University of Sussex

Effect sizes in meta-analysis

What we need

To do a meta-analysis we need (from each paper)

  • An effect size
  • It’s associated variance/standard error

Effect size

Standardized version of a model parameter

Common examples

  • Cohen’s d
  • Pearson’s r
  • Odds ratio
  • Standardized \(\beta\)

Cohens \(\hat{d}\)

Cohens \(\hat{d}\)

Quantifies the difference between group means

\[ \begin{aligned} \hat{d} &= \frac{\overline{X}_1-\overline{X}_2}{s_p} \\ s_p &= \sqrt{\frac{(N_1-1)s^2_1 + (N_2-1)s^2_2}{N_1 + N_2 -2}} \end{aligned} \]

Key points

  • Typically used to quantify differences between groups
    • Experimental research
  • Sometimes reported in papers
    • Also need \(SE_d\)
  • To calculate it you need to extract from papers
    • Means of both groups (\(\overline{X}_1\) and \(\overline{X}_2\))
    • SDs of both groups (\(s^2_1\) and \(s^2_2\))
    • Sample size of both groups (\(N_1\) and \(N_2\))
  • Usually convert to Hedges \(g\), which is unbiased

Pearson’s \(r\)

Pearson’s \(r\)

Quantifies the association between two continuous variables

\[ \begin{aligned} r &= \frac{\sum(x- \overline{X})(y - \overline{Y})}{(N-1)s_xs_y} \\ \end{aligned} \]

Key points

  • Typically used to quantify associations between variables
    • Observational/cross-sectional research
  • To calculate it you need to extract from papers
    • Pearson’s \(r\) (because usually it’s directly reported)
    • Sample size (\(N\)) or the \(SE_r\) (not usually reported)

Odds ratio (OR)

Odds ratio (OR)

Quantifies the association between two categorical variables

Delivered Not delivered Total
Christmas pudding 150 28 178
Mulled wine 100 122 222
Total 250 150 400

\[ \begin{aligned} \text{odds}_\text{delivered after pudding} &= \frac{\text{Number delivered after pudding}}{\text{Number not delivered after pudding}} \\ &= \frac{150}{28} \\ &= 5.36 \\ \text{odds}_\text{delivered after wine} &= \frac{\text{Number delivered after wine}}{\text{Number not delivered after wine}} \\ &= \frac{100}{122} \\ &= 0.82 \\ \text{odds ratio} &= \frac{\text{odds}_\text{delivered after wine}}{\text{odds}_\text{delivered after pudding}} \\ &= \frac{0.82}{5.36} \\ &= 0.15 \end{aligned} \]

Odds ratio (OR)

Key points

  • Typically used to quantify associations between categorical variables
    • Studies with frequency data or dichotomous outcomes (e.g. recovered/not)
  • To calculate it you need to extract from papers
    • Raw frequencies
    • \(SE_{OR}\) can be calculated from raw frequencies too

Note

Pearce, L. J., & Field, A. P. (2016). The impact of ‘scary’ tv and film on children’s internalizing emotions: A meta-analysis. Human Communication Research, 42, 98–121. doi: doi.org/10.1111/hcre.12069

  • Pearson’s r
    • Quantifying quantity of exposure to scary TV and measures of internalising
  • Moderators
    • Experimental or correlational
    • Self-report of physiological outcome
    • Responder (Child, Parent, Both)
    • Outcome measure (Fear, PTSD, Sadness etc)
    • Age (mean, and age < 10)
    • Media type (TV only or mixed media)
    • Media Content (fact vs. fantasy)
    • Violent content

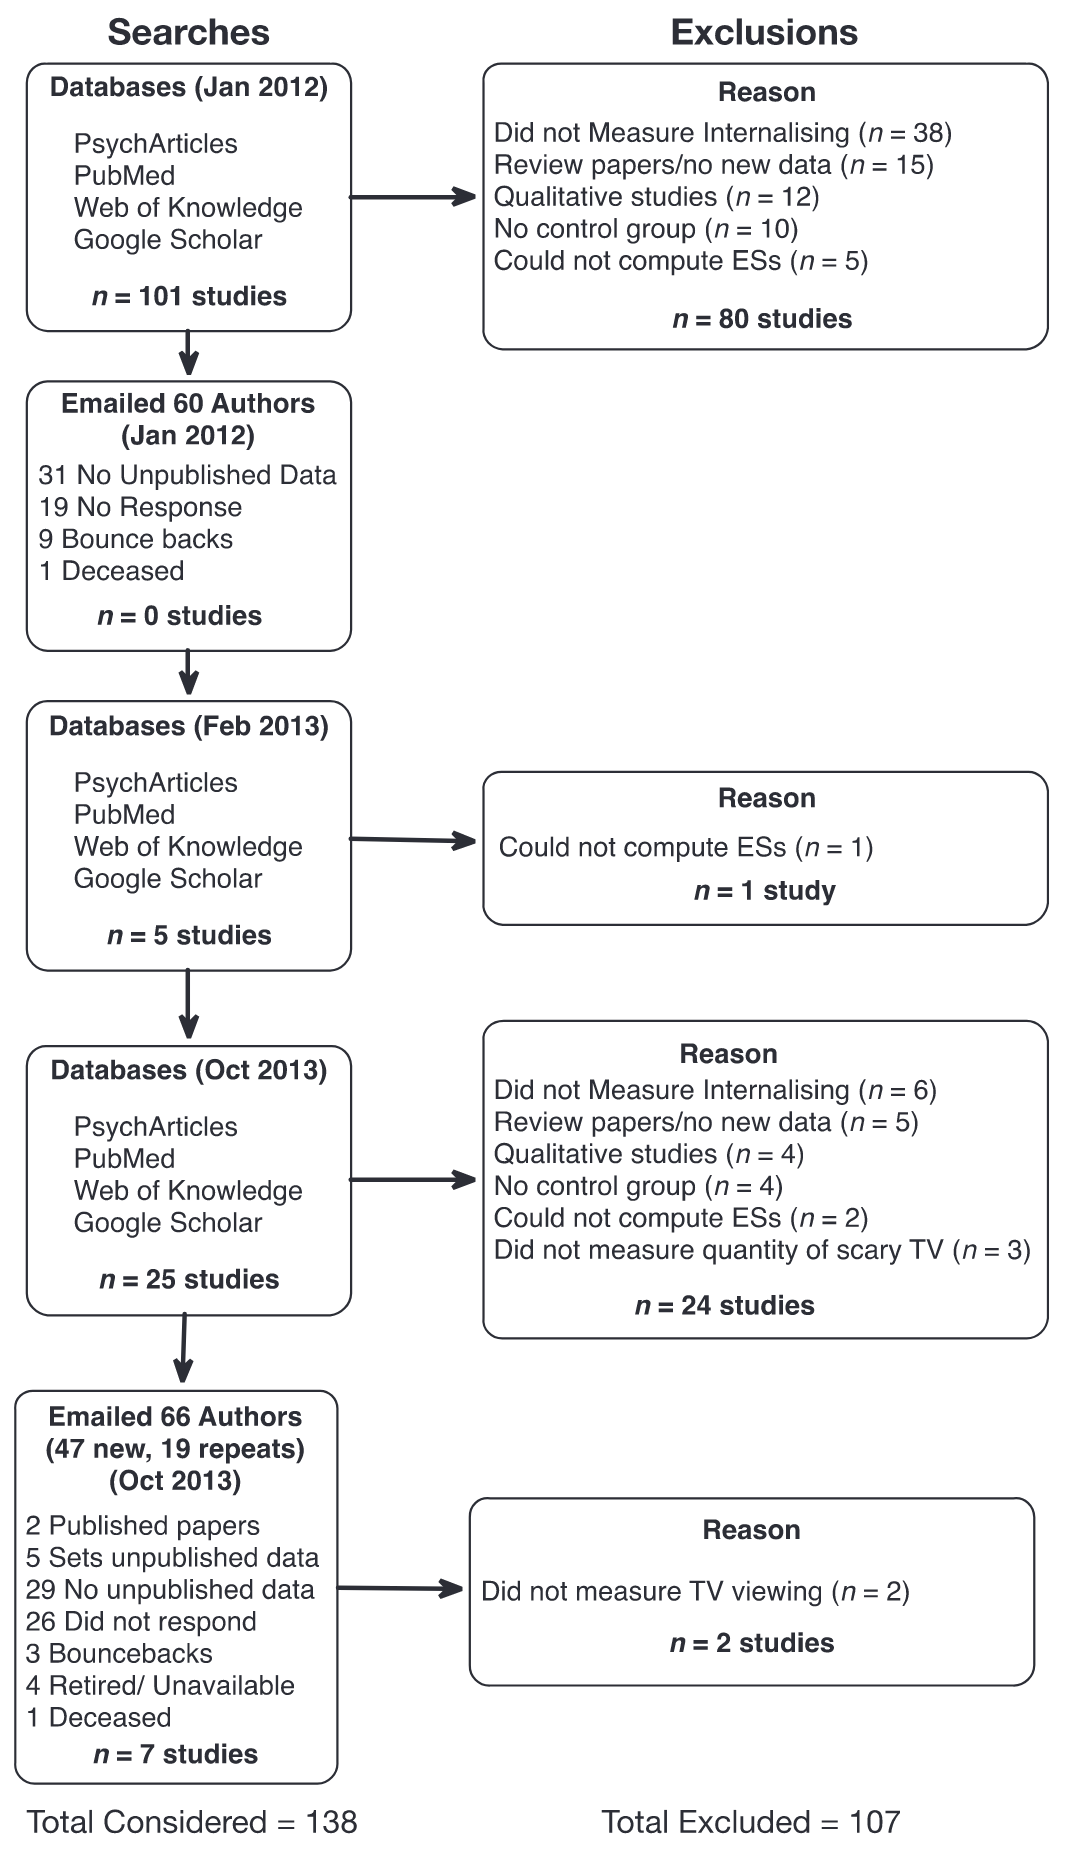
  1. Outcomes were reported only for children aged 18 years and under, including self-report by the child, parent reports of child behaviour, and physiological measures in an experimental laboratory setting.If a study included an age range with an upper limit beyond 18 years, it was excluded.
  2. The primary outcomes included measures of internalizing behaviours such as fear, anxiety, worry, sadness, and depression. Studies which focused specifically on externalizing behaviours such as aggression and violence were excluded because the focus of this study was internalized emotions.
  3. Initially, studies were selected for inclusion if the outcome measures were clinically validated scales or physiological measures. However, due to the limited number of studies including such measures, inclusion criteria were broadened to include non validated self-report measures such as Likert and visual analogue measures of fear, anxiety, etc.
  4. Experimental studies must include a control group or condition, either a baseline measurement before exposure to television, or a group with no, or limited exposure to television. Correlational studies must have measured the quantity of exposure to warrant inclusion.
  5. There needed to be sufficient information to compute effect sizes.

Note

Brewin, C. & Field, A. P. (2024). Meta-analysis shows trauma memories in PTSD lack coherence: A response to Taylor et al. (2022). https://osf.io/597hr/

  • Hedges’s \(g\)
    • Quantifying memory disorganization in those with PTSD vs not
  • Moderators
    • Does study use FOA methodology
    • Measure (organization vs disorganization)
    • Age (Youth vs adult)