class: center, middle, title-slide, inverse, no-scribble layout: false background-image: url("media/dragon_castle_ppt_background_dark.jpg") background-size: cover # The Beast of Bias ## Professor Andy Field <div> <img style="vertical-align:middle; width:30px; height:30px" src="media/twitter_60.png"> <span style="line-height:40px;">@profandyfield</span> </div> <div> <img style="vertical-align:middle; width:60px" src="media/youtube.png"> <span style="line-height:40px;">www.youtube.com/user/ProfAndyField/</span> </div> <div> <img style="vertical-align:middle; width:30px; height:30px" src="media/ds_com_fav.png"> <span style="line-height:40px;">www.discoveringstatistics.com</span> </div> <div> <img style="vertical-align:middle; width:30px; height:30px" src="media/milton_grey_fav.png"> <span style="line-height:40px;">www.milton-the-cat.rocks</span> </div> <div> <img style="vertical-align:middle; width:30px; height:30px" src="media/discovr_fav.png"> <span style="line-height:40px;">www.discovr.rocks</span> </div> ??? h or ?: Toggle the help window j: Jump to next slide k: Jump to previous slide b: Toggle blackout mode m: Toggle mirrored mode. p: Toggle PresenterMode f: Toggle Fullscreen t: Reset presentation timer <number> + <Return>: Jump to slide <number> c: Create a clone presentation on a new window --- class: inverse background-image: url("media/lone_knight.jpg") background-size: cover class: no-scribble <audio controls> <source src="media/beast_of_bias_narration.mp3" type="audio/mpeg"> <source src="media/beast_of_bias_narration.ogg" type="audio/ogg"/> </audio> .center[All is not well in the island of linearis modelus. For years, humans and dragons have lived in harmony, until recently. The rulers of the 134 kingdoms want the island for themselves. Through a campaign of propaganda, they have convinced their subjects that the dragons should be banished. They have sent their best knights to slay the dragons. Only Melvin, a wise wizzard of statistics, can save them. He meets with the commander in chief of the knights of the 134 kingdoms.] ??? I am Melvin, a wise wizzard of statistics. Who are you? --- background-image: none background-color: #000000 class: no-scribble <video width="100%" height="100%" controls id="my_video"> <source src="media/zach_i_am_zach_field_caption.mp4" type="video/mp4"> </video> ??? And what have you been sent to do? --- background-image: none background-color: #000000 class: no-scribble <video width="100%" height="100%" controls id="my_video"> <source src="media/zach_kill_dragons_thank_you_caption.mp4" type="video/mp4"> </video> ??? But dragons are nice, why would you want to do that? --- background-image: none background-color: #000000 class: no-scribble <video width="100%" height="100%" controls id="my_video"> <source src="media/zach_reasons_captions.mp4" type="video/mp4"> </video> ??? That seems very old fashioned - I'm sure they kidnap princes too --- background-image: none background-color: #000000 class: no-scribble <video width="100%" height="100%" controls id="my_video"> <source src="media/zach-only_kidnap_princesses_caption.mp4" type="video/mp4"> </video> ??? I'd better see what the dragons have to say about this. --- background-image: none background-color: #000000 class: no-scribble <video width="100%" height="100%" controls id="my_video"> <source src="media/arlo_stop_zach_caption.mp4" type="video/mp4"> </video> ??? Oh dear oh dear. I must save the dragons. Let's look at those graphs again ... --- class: center  ??? We've seen this map of the process of fitting models before --- class: center  ??? Today we focus on the final parts of the process - assessing bias in the model, and corrective action. --- class: center, middle, title-slide, inverse layout: false ## Part 1: Outliers and do dragons eat sheep? > "Coz they eat all our sheep" > > *Sir Knight Zach, Defender of the world of Military* --- class: middle, center <!-- --> ??? This is the plot the night showed me of the number of dragons in each area of the kingdom, and how many livestock were killed per week. It looks as though there is a positive relationship. Residual looks huge, which means it is an outlier, but this doesn't necessarily mean that it has influenced the model. To see whether it has influenced the model we need to look at what happens when we fit the model *without* that observation (or those observations). --- class: middle, center <!-- --> ??? As you can see, without those observations, the line becomes flatter. --- ## Detecting outliers and influential cases + Graphs + Scatterplots (less helpful with several predictors) + Histograms -- + Standardized residual + In an average sample, 95% of standardized residuals should lie between `\(\pm 2\)` + 99% of standardized residuals should lie between `\(\pm 2.5\)` + Any case for which the absolute value of the standardized residual is 3 or more, is likely to be an outlier -- + Cook’s distance + Measures the *influence* of a single case on the model as a whole + Absolute values greater than 1 are cause for concern (Cook & Weisberg , 1982), but check any > 0.5. -- + DF beta statistics (unstandardized or standardized) + The change in *b* when a case is removed + Be wary of standardized values with absolute values > 1 ??? DF beta shows us the change in the line that we just spoke about. --- # Influential cases ```r out_lm <- lm(livestock ~ dragons, data = out_tib) # plot(out_lm, which = 4) ggplot2::autoplot(out_lm,which = 4,colour = "#5c97bf", alpha = 0.5, size = 1) + theme_minimal() ``` -- .center[ 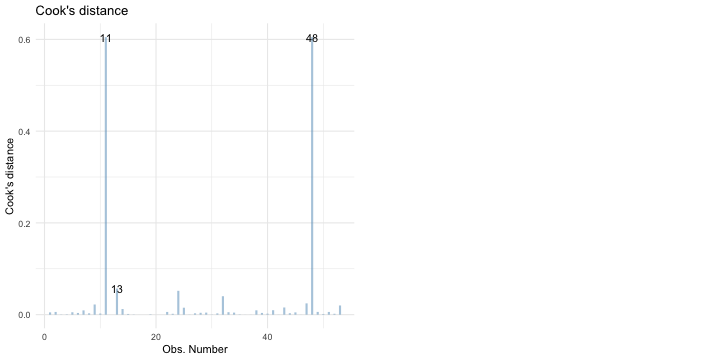<!-- --> ] ??? There are, in fact two influential cases, not one. But they have the same values. Cook's is OK, but the df beta (standardized) f or the slope is > 1 giving cause for concern. We'd look at whether there were explanations for these observations being unusual. For example ... --- background-image: none background-color: #000000 class: no-scribble <video width="100%" height="100%" controls id="my_video"> <source src="media/shrek_burp.mp4" type="video/mp4"> </video> ??? These two cases were kingdoms containing Ogres and not dragons. Given we want to know about the relationship between the dragon population and livestock deaths, we might reasonable fit the model without the kingdoms containing Ogres. What happens if we remove these cases? --- .center[ ## Full sample <table> <thead> <tr> <th style="text-align:left;"> term </th> <th style="text-align:right;"> estimate </th> <th style="text-align:right;"> std.error </th> <th style="text-align:right;"> statistic </th> <th style="text-align:right;"> p.value </th> </tr> </thead> <tbody> <tr> <td style="text-align:left;"> (Intercept) </td> <td style="text-align:right;"> 18.82 </td> <td style="text-align:right;"> 2.93 </td> <td style="text-align:right;"> 6.43 </td> <td style="text-align:right;"> 0.00 </td> </tr> <tr> <td style="text-align:left;"> dragons </td> <td style="text-align:right;"> 1.38 </td> <td style="text-align:right;"> 0.53 </td> <td style="text-align:right;"> 2.59 </td> <td style="text-align:right;"> 0.01 </td> </tr> </tbody> </table> ] -- .center[ ## Influential cases removed <table> <thead> <tr> <th style="text-align:left;"> term </th> <th style="text-align:right;"> estimate </th> <th style="text-align:right;"> std.error </th> <th style="text-align:right;"> statistic </th> <th style="text-align:right;"> p.value </th> </tr> </thead> <tbody> <tr> <td style="text-align:left;"> (Intercept) </td> <td style="text-align:right;"> 22.27 </td> <td style="text-align:right;"> 1.64 </td> <td style="text-align:right;"> 13.60 </td> <td style="text-align:right;"> 0.00 </td> </tr> <tr> <td style="text-align:left;"> dragons </td> <td style="text-align:right;"> 0.31 </td> <td style="text-align:right;"> 0.31 </td> <td style="text-align:right;"> 0.99 </td> <td style="text-align:right;"> 0.33 </td> </tr> </tbody> </table> ] ??? When we look only at kingdoms with dragons, the significant remlationship between dragon numbers and livestock deaths is not significant - most important, it has dropped to virtually zero. --- # Robust estimation (optional) .pull-left[ ## Normal model (OLS) ```r out_lm <- lm(livestock ~ dragons, data = out_tib) broom::tidy(out_lm) ``` <table> <thead> <tr> <th style="text-align:left;"> term </th> <th style="text-align:right;"> estimate </th> <th style="text-align:right;"> std.error </th> <th style="text-align:right;"> statistic </th> <th style="text-align:right;"> p.value </th> </tr> </thead> <tbody> <tr> <td style="text-align:left;"> (Intercept) </td> <td style="text-align:right;"> 18.82 </td> <td style="text-align:right;"> 2.93 </td> <td style="text-align:right;"> 6.43 </td> <td style="text-align:right;"> 0.00 </td> </tr> <tr> <td style="text-align:left;"> dragons </td> <td style="text-align:right;"> 1.38 </td> <td style="text-align:right;"> 0.53 </td> <td style="text-align:right;"> 2.59 </td> <td style="text-align:right;"> 0.01 </td> </tr> </tbody> </table> ] ??? When we look only at kingdoms with dragons, the significant relationship between dragon numbers and livestock deaths is not significant - most important, it has dropped to virtually zero. -- .pull-right[ ## Robust model ```r out_rob <- robust::lmRob(livestock ~ dragons, data = out_tib) summary(out_rob) ``` <table> <thead> <tr> <th style="text-align:left;"> </th> <th style="text-align:right;"> Estimate </th> <th style="text-align:right;"> Std. Error </th> <th style="text-align:right;"> t value </th> <th style="text-align:right;"> Pr(>|t|) </th> </tr> </thead> <tbody> <tr> <td style="text-align:left;"> (Intercept) </td> <td style="text-align:right;"> 22.35 </td> <td style="text-align:right;"> 1.81 </td> <td style="text-align:right;"> 12.36 </td> <td style="text-align:right;"> 0.00 </td> </tr> <tr> <td style="text-align:left;"> dragons </td> <td style="text-align:right;"> 0.30 </td> <td style="text-align:right;"> 0.34 </td> <td style="text-align:right;"> 0.88 </td> <td style="text-align:right;"> 0.38 </td> </tr> </tbody> </table> ] --- background-image: none background-color: #000000 class: no-scribble <video width="100%" height="100%" controls id="my_video"> <source src="media/arlo_have_you_saved_the_dragons_yet_2_caption.mp4" type="video/mp4"> </video> ??? I think I may have done ... CLICK --- background-image: url("media/zach_knight.jpg") background-color: #000000 class: no-scribble ??? So, you see, it was the ogre's eating the sheep. Without them there's no significant relationship between the number of dragons and the number of sheep eaten. Can you stop killing the dragons now? CLICK --- background-image: none background-color: #000000 class: no-scribble <video width="100%" height="100%" controls id="my_video"> <source src="media/zach_shakes_head.mp4" type="video/mp4"> </video> ??? CLICK: Zach chasing Arlo .... --- background-image: none background-color: #000000 class: no-scribble <video width="100%" height="100%" controls id="my_video"> <source src="media/dragon_chase.mp4" type="video/mp4"> </video> ??? --- class: center, middle, title-slide, inverse layout: false ## Part 2: Linearity, spherical errors and do dragons kidnap royalty? > "Coz they kidnap the princesses" > > *Sir Knight Zach, Defender of the world of Military* --- background-image: none ## Are more princesses kidnapped in areas with more dragons? .center[ .ong[ `$$\hat{\text{royalty}}_i = 3.98 + 0.12\text{dragons}_{i}$$` ] <table> <thead> <tr> <th style="text-align:left;"> term </th> <th style="text-align:right;"> estimate </th> <th style="text-align:right;"> std.error </th> <th style="text-align:right;"> statistic </th> <th style="text-align:right;"> p.value </th> <th style="text-align:right;"> conf.low </th> <th style="text-align:right;"> conf.high </th> </tr> </thead> <tbody> <tr> <td style="text-align:left;"> (Intercept) </td> <td style="text-align:right;"> 3.98 </td> <td style="text-align:right;"> 0.30 </td> <td style="text-align:right;"> 13.32 </td> <td style="text-align:right;"> 0.00 </td> <td style="text-align:right;"> 3.39 </td> <td style="text-align:right;"> 4.57 </td> </tr> <tr> <td style="text-align:left;"> dragons </td> <td style="text-align:right;"> 0.12 </td> <td style="text-align:right;"> 0.06 </td> <td style="text-align:right;"> 2.07 </td> <td style="text-align:right;"> 0.04 </td> <td style="text-align:right;"> 0.01 </td> <td style="text-align:right;"> 0.23 </td> </tr> </tbody> </table> <br> ] -- .center[ 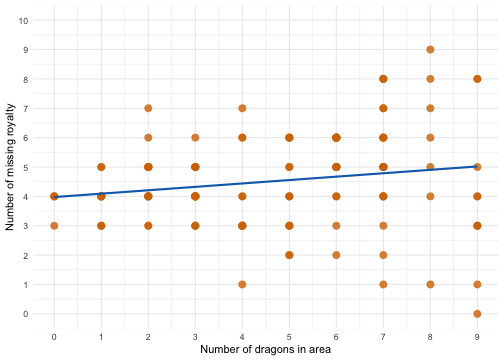<!-- --> ] ??? It seems like the number of dragons in an area significantly predicts the number of princesses kidnapped --- background-image: none ## Are more princesses kidnapped in areas that have dragons? .center[ .ong[ `$$\hat{\text{royalty}}_i = 4.26 + 1.21\text{dragons}_{i}$$` ] <table> <thead> <tr> <th style="text-align:left;"> term </th> <th style="text-align:right;"> estimate </th> <th style="text-align:right;"> std.error </th> <th style="text-align:right;"> statistic </th> <th style="text-align:right;"> p.value </th> <th style="text-align:right;"> conf.low </th> <th style="text-align:right;"> conf.high </th> </tr> </thead> <tbody> <tr> <td style="text-align:left;"> (Intercept) </td> <td style="text-align:right;"> 4.26 </td> <td style="text-align:right;"> 0.41 </td> <td style="text-align:right;"> 10.28 </td> <td style="text-align:right;"> 0.00 </td> <td style="text-align:right;"> 3.43 </td> <td style="text-align:right;"> 5.08 </td> </tr> <tr> <td style="text-align:left;"> dragonsDragons </td> <td style="text-align:right;"> 1.21 </td> <td style="text-align:right;"> 0.53 </td> <td style="text-align:right;"> 2.27 </td> <td style="text-align:right;"> 0.03 </td> <td style="text-align:right;"> 0.15 </td> <td style="text-align:right;"> 2.26 </td> </tr> </tbody> </table> <br> ] -- .center[ 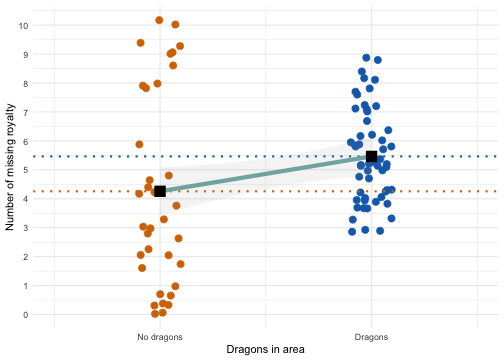<!-- --> ] ??? It seems like significantly more princesses are kidnapped in areas that have dragons compared to those without --- # Key assumptions of the General Linear Model ## Linearity and additivity -- ## Spherical errors The population model should have: * Homoscedastic errors + Inspect the model residuals * Independent errors + Inspect the model residuals -- ## Normality of something-or-other * Population model errors * Sampling distribution --- # Linearity and additivity The relationship between predictor(s) and outcome is, in reality, linear .ong[ .eq_lrge[ `$$\text{royalty}_i = \hat{b}_0 + \hat{b}_1\text{dragons}_{i} + e_i$$` ] ] The combined effect of predictors is additive .ong[ .eq_lrge[ `$$\text{royalty}_i = \hat{b}_0 + \hat{b}_1\text{dragons}_{i} + \hat{b}_2\text{strict regime}_{i} + e_i$$` ] ] .tip[ <svg style="height:1.5em; top:.04em; position: relative; fill: #2C5577;" viewBox="0 0 640 512"><path d="M512,176a16,16,0,1,0-16-16A15.9908,15.9908,0,0,0,512,176ZM576,32.72461V32l-.46094.3457C548.81445,12.30469,515.97461,0,480,0s-68.81445,12.30469-95.53906,32.3457L384,32v.72461C345.35156,61.93164,320,107.82422,320,160c0,.38086.10938.73242.11133,1.11328A272.01015,272.01015,0,0,0,96,304.26562V176A80.08413,80.08413,0,0,0,16,96a16,16,0,0,0,0,32,48.05249,48.05249,0,0,1,48,48V432a80.08413,80.08413,0,0,0,80,80H352a32.03165,32.03165,0,0,0,32-32,64.0956,64.0956,0,0,0-57.375-63.65625L416,376.625V480a32.03165,32.03165,0,0,0,32,32h32a32.03165,32.03165,0,0,0,32-32V316.77539A160.036,160.036,0,0,0,640,160C640,107.82422,614.64844,61.93164,576,32.72461ZM480,32a126.94015,126.94015,0,0,1,68.78906,20.4082L512,80H448L411.21094,52.4082A126.94015,126.94015,0,0,1,480,32Zm64,64v64a64,64,0,0,1-128,0V96l21.334,16h85.332ZM480,480H448V351.99609A15.99929,15.99929,0,0,0,425.5,337.377L303.1875,391.75a100.1169,100.1169,0,0,0-67.25-84.89062,7.96929,7.96929,0,0,0-10.09375,5.76562l-3.875,15.5625a8.16346,8.16346,0,0,0,5.375,9.5625C252,346.875,272,375.625,272,401.90625V448h48a32.03165,32.03165,0,0,1,32,32H144c-26.94531,0-48.13086-22.27344-47.99609-49.21875.63671-127.52734,101.31054-231.53516,227.36914-238.14063A160.02931,160.02931,0,0,0,480,320Zm0-192A128.14414,128.14414,0,0,1,352,160c0-32.16992,12.334-61.25391,32-83.76367V160a96,96,0,0,0,192,0V76.23633C595.666,98.74609,608,127.83008,608,160A128.14414,128.14414,0,0,1,480,288ZM432,160a16,16,0,1,0,16-16A15.9908,15.9908,0,0,0,432,160ZM162.94531,68.76953l39.71094,16.56055,16.5625,39.71094a5.32345,5.32345,0,0,0,9.53906,0l16.5586-39.71094,39.71484-16.56055a5.336,5.336,0,0,0,0-9.541l-39.71484-16.5586L228.75781,2.957a5.325,5.325,0,0,0-9.53906,0l-16.5625,39.71289-39.71094,16.5586a5.336,5.336,0,0,0,0,9.541Z"/></svg> Test linearity using plots. If the data cloud looks banana shaped (curved), linearity probably can't be assumed. ] ??? Imagine we factored in how strict the regime was (i.e. how restricted royalty were and how much they were expected to conform to traditional roles. Might predict their desire to escape.). The effect of how many dragons and the regime of interest should be, in reality, additive. --- # Errors vs. Residuals .tip[ <svg style="height:1.5em; top:.04em; position: relative; fill: #2C5577;" viewBox="0 0 640 512"><path d="M512,176a16,16,0,1,0-16-16A15.9908,15.9908,0,0,0,512,176ZM576,32.72461V32l-.46094.3457C548.81445,12.30469,515.97461,0,480,0s-68.81445,12.30469-95.53906,32.3457L384,32v.72461C345.35156,61.93164,320,107.82422,320,160c0,.38086.10938.73242.11133,1.11328A272.01015,272.01015,0,0,0,96,304.26562V176A80.08413,80.08413,0,0,0,16,96a16,16,0,0,0,0,32,48.05249,48.05249,0,0,1,48,48V432a80.08413,80.08413,0,0,0,80,80H352a32.03165,32.03165,0,0,0,32-32,64.0956,64.0956,0,0,0-57.375-63.65625L416,376.625V480a32.03165,32.03165,0,0,0,32,32h32a32.03165,32.03165,0,0,0,32-32V316.77539A160.036,160.036,0,0,0,640,160C640,107.82422,614.64844,61.93164,576,32.72461ZM480,32a126.94015,126.94015,0,0,1,68.78906,20.4082L512,80H448L411.21094,52.4082A126.94015,126.94015,0,0,1,480,32Zm64,64v64a64,64,0,0,1-128,0V96l21.334,16h85.332ZM480,480H448V351.99609A15.99929,15.99929,0,0,0,425.5,337.377L303.1875,391.75a100.1169,100.1169,0,0,0-67.25-84.89062,7.96929,7.96929,0,0,0-10.09375,5.76562l-3.875,15.5625a8.16346,8.16346,0,0,0,5.375,9.5625C252,346.875,272,375.625,272,401.90625V448h48a32.03165,32.03165,0,0,1,32,32H144c-26.94531,0-48.13086-22.27344-47.99609-49.21875.63671-127.52734,101.31054-231.53516,227.36914-238.14063A160.02931,160.02931,0,0,0,480,320Zm0-192A128.14414,128.14414,0,0,1,352,160c0-32.16992,12.334-61.25391,32-83.76367V160a96,96,0,0,0,192,0V76.23633C595.666,98.74609,608,127.83008,608,160A128.14414,128.14414,0,0,1,480,288ZM432,160a16,16,0,1,0,16-16A15.9908,15.9908,0,0,0,432,160ZM162.94531,68.76953l39.71094,16.56055,16.5625,39.71094a5.32345,5.32345,0,0,0,9.53906,0l16.5586-39.71094,39.71484-16.56055a5.336,5.336,0,0,0,0-9.541l-39.71484-16.5586L228.75781,2.957a5.325,5.325,0,0,0-9.53906,0l-16.5625,39.71289-39.71094,16.5586a5.336,5.336,0,0,0,0,9.541Z"/></svg> * A model's **ERROR**s refer to the differences between predicted values and observed values of the outcome variable **in the population model** * These values cannot be observed ] <br> .tip[ <svg style="height:1.5em; top:.04em; position: relative; fill: #2C5577;" viewBox="0 0 640 512"><path d="M512,176a16,16,0,1,0-16-16A15.9908,15.9908,0,0,0,512,176ZM576,32.72461V32l-.46094.3457C548.81445,12.30469,515.97461,0,480,0s-68.81445,12.30469-95.53906,32.3457L384,32v.72461C345.35156,61.93164,320,107.82422,320,160c0,.38086.10938.73242.11133,1.11328A272.01015,272.01015,0,0,0,96,304.26562V176A80.08413,80.08413,0,0,0,16,96a16,16,0,0,0,0,32,48.05249,48.05249,0,0,1,48,48V432a80.08413,80.08413,0,0,0,80,80H352a32.03165,32.03165,0,0,0,32-32,64.0956,64.0956,0,0,0-57.375-63.65625L416,376.625V480a32.03165,32.03165,0,0,0,32,32h32a32.03165,32.03165,0,0,0,32-32V316.77539A160.036,160.036,0,0,0,640,160C640,107.82422,614.64844,61.93164,576,32.72461ZM480,32a126.94015,126.94015,0,0,1,68.78906,20.4082L512,80H448L411.21094,52.4082A126.94015,126.94015,0,0,1,480,32Zm64,64v64a64,64,0,0,1-128,0V96l21.334,16h85.332ZM480,480H448V351.99609A15.99929,15.99929,0,0,0,425.5,337.377L303.1875,391.75a100.1169,100.1169,0,0,0-67.25-84.89062,7.96929,7.96929,0,0,0-10.09375,5.76562l-3.875,15.5625a8.16346,8.16346,0,0,0,5.375,9.5625C252,346.875,272,375.625,272,401.90625V448h48a32.03165,32.03165,0,0,1,32,32H144c-26.94531,0-48.13086-22.27344-47.99609-49.21875.63671-127.52734,101.31054-231.53516,227.36914-238.14063A160.02931,160.02931,0,0,0,480,320Zm0-192A128.14414,128.14414,0,0,1,352,160c0-32.16992,12.334-61.25391,32-83.76367V160a96,96,0,0,0,192,0V76.23633C595.666,98.74609,608,127.83008,608,160A128.14414,128.14414,0,0,1,480,288ZM432,160a16,16,0,1,0,16-16A15.9908,15.9908,0,0,0,432,160ZM162.94531,68.76953l39.71094,16.56055,16.5625,39.71094a5.32345,5.32345,0,0,0,9.53906,0l16.5586-39.71094,39.71484-16.56055a5.336,5.336,0,0,0,0-9.541l-39.71484-16.5586L228.75781,2.957a5.325,5.325,0,0,0-9.53906,0l-16.5625,39.71289-39.71094,16.5586a5.336,5.336,0,0,0,0,9.541Z"/></svg> * A model's **RESIDUAL**s refer to the differences between predicted values and observed values of the outcome variable **in the sample model** * These values can be observed and are representative of the population model errors. ] --- class: center, middle background-image: none # Errors vs residuals  ??? The assumptions relate to the population, which of course we cannot observe. --- class: center, middle background-image: none # Errors vs residuals  ??? The population model will not be perfect. There will be error in prediction. These errors are known as disturbances or errors. Assumptions relate to these. --- class: center, middle background-image: none # Errors (Population model)  --- class: center, middle background-image: none # Errors (not observable)  ??? Assumptions relate to population errors. For example, we assume they have a normal distribution when we use OLS estimation. We cannot test this assumption directly because we cannot observe errors. --- class: center, middle background-image: none # Residuals (are observable)  ??? Instead we look at the errors in prediction in the sample (known as residuals). If residuals are normally distributed then the population errors are likley to be as well. --- # Spherical errors ## Errors should be independent + The .blu[population error] in prediction for one case should not be related to the error in prediction for another case (.blu[autocorrelation]). + Independent observations tend to lead to independent errors + **Because we cannot observe population errors we inspect the sample residuals** -- ## Errors should be homoscedastic + Variance of population errors (residuals) should be consistent at different values of the predictor variable + **Because we cannot observe population errors we inspect the sample residuals** -- ## Violation of the assumption * *b*s are unbiased but not optimal * Standard error is incorrect + Therefore, *t*-tests, *p*-values and confidence intervals will also be incorrect --- background-image: none # Residuals vs. Predicted values .center[ 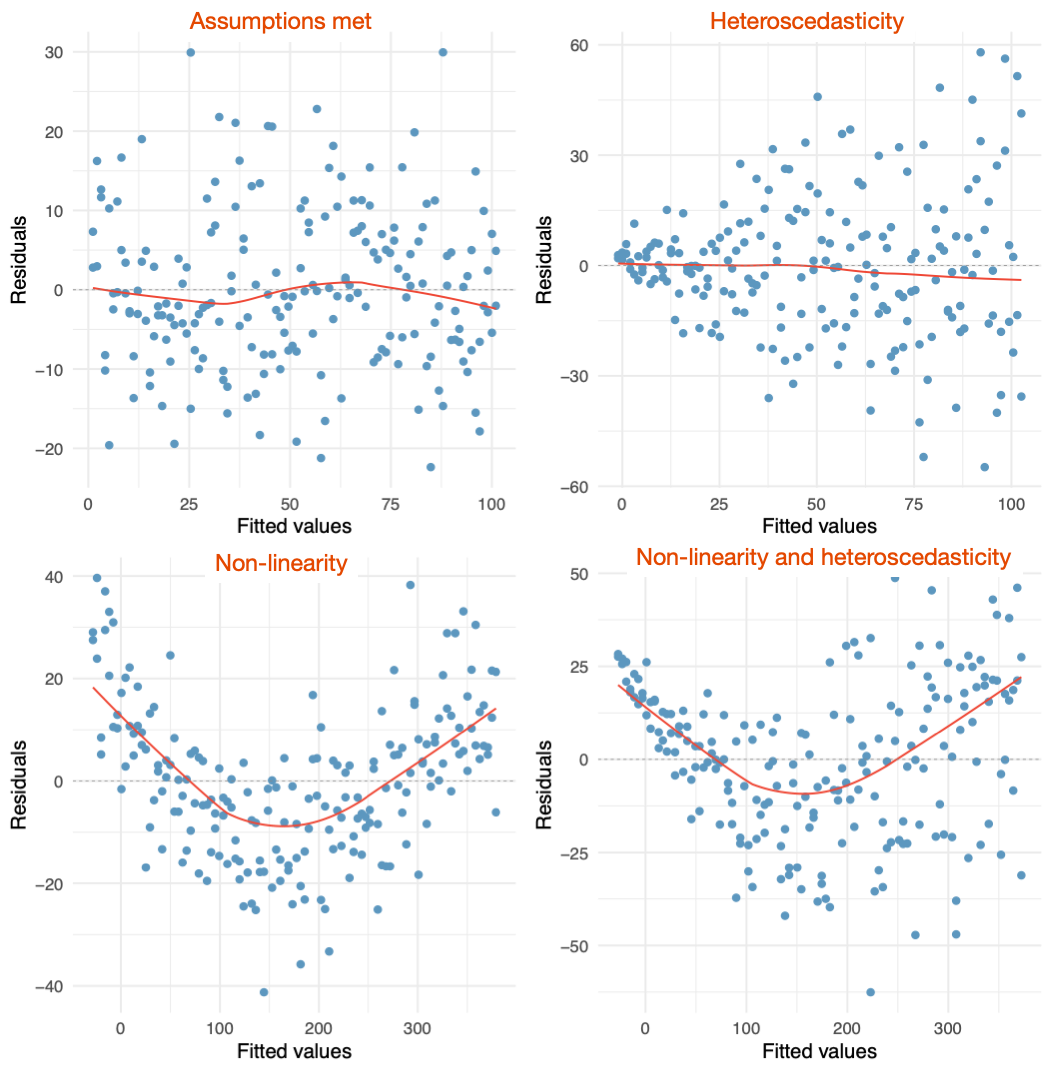 ] --- background-image: none # Residuals vs. Predicted values .center[ 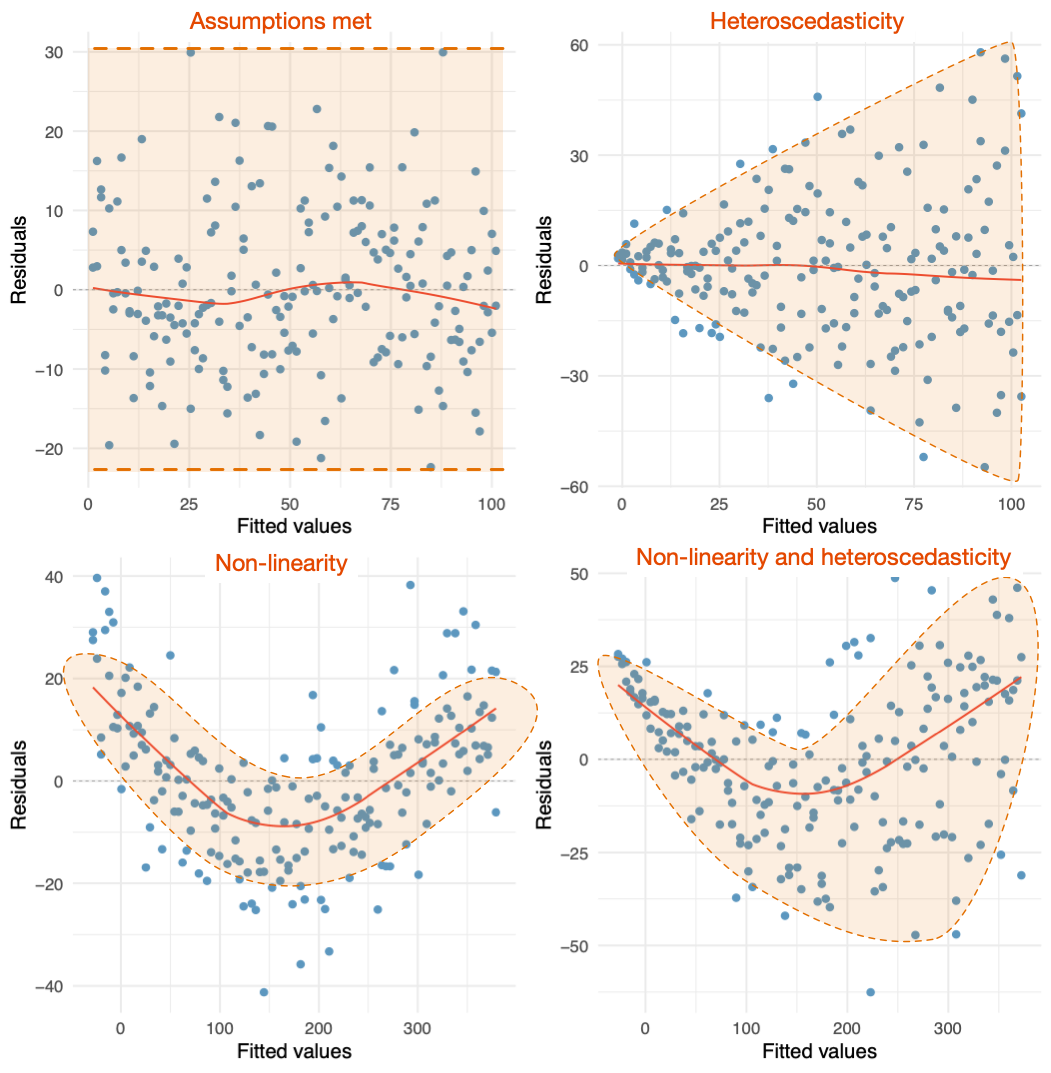 ] --- .pull-left[ ### Homoscedastic  ] -- .pull-right[ ### Our data  ] --- .pull-left[ ### Homoscedastic  ] .pull-right[ ### Our data: Heteroscedastic  ] --- .pull-left[ ### Homoscedastic  ] -- .pull-right[ ### Our data  ] --- .pull-left[ ### Homoscedastic  ] .pull-right[ ### Our data: Heteroscedastic  ] --- background-image: none background-color: #000000 class: no-scribble <video width="100%" height="100%" controls id="my_video"> <source src="media/heteroscedasticity_song.mp4" type="video/mp4"> </video> --- # Levene’s Test You might hear about it but **don’t use it**: think about what we know about sample sizes and significance. For the avoidance of doubt, **don’t use it**. One more time ... **don’t use it** --- background-image: none background-color: #000000 class: no-scribble <video width="100%" height="100%" controls id="my_video"> <source src="media/shocked_baby_levene.mp4" type="video/mp4"> </video> --- background-image: none background-color: #000000 class: no-scribble <video width="100%" height="100%" controls id="my_video"> <source src="media/zach_dragon_hunt_caption.mp4" type="video/mp4"> </video> --- background-image: none background-color: #000000 class: no-scribble <video width="100%" height="100%" controls id="my_video"> <source src="media/dragon_chase_2.mp4" type="video/mp4"> </video> ??? --- class: center, middle, title-slide, inverse layout: false ## Part 3: Normality and does dragons poo kill crops? > "Coz their dung doesn't help our crops to grow" > > *Sir Knight Zach, Defender of the world of Military* --- background-image: none ## Does dung help crop yield? .center[ .ong[ `$$\hat{\text{yield}}_i = 14.34 + 2.02\text{poop}_{i}$$` ] <table> <thead> <tr> <th style="text-align:left;"> term </th> <th style="text-align:right;"> estimate </th> <th style="text-align:right;"> std.error </th> <th style="text-align:right;"> statistic </th> <th style="text-align:right;"> p.value </th> <th style="text-align:right;"> conf.low </th> <th style="text-align:right;"> conf.high </th> </tr> </thead> <tbody> <tr> <td style="text-align:left;"> (Intercept) </td> <td style="text-align:right;"> 14.34 </td> <td style="text-align:right;"> 6.77 </td> <td style="text-align:right;"> 2.12 </td> <td style="text-align:right;"> 0.04 </td> <td style="text-align:right;"> 0.56 </td> <td style="text-align:right;"> 28.12 </td> </tr> <tr> <td style="text-align:left;"> poop </td> <td style="text-align:right;"> 2.02 </td> <td style="text-align:right;"> 1.37 </td> <td style="text-align:right;"> 1.48 </td> <td style="text-align:right;"> 0.15 </td> <td style="text-align:right;"> -0.77 </td> <td style="text-align:right;"> 4.82 </td> </tr> </tbody> </table> <br> ] -- .center[ <!-- --> ] ??? It seems like the amount of poop doesn't sig. affect crop yield. --- # Normally distributed errors .warning[ <svg style="height: 1em; top:.04em; position: relative; fill: #CA3E34;" viewBox="0 0 576 512"><path d="M192,320h32V224H192Zm160,0h32V224H352ZM544,112H512a32.03165,32.03165,0,0,0-32,32v16H416V128h32a32.03165,32.03165,0,0,0,32-32V64a32.03165,32.03165,0,0,0-32-32H416a32.03165,32.03165,0,0,0-32,32H352a32.03165,32.03165,0,0,0-32,32v32H256V96a32.03165,32.03165,0,0,0-32-32H192a32.03165,32.03165,0,0,0-32-32H128A32.03165,32.03165,0,0,0,96,64V96a32.03165,32.03165,0,0,0,32,32h32v32H96V144a32.03165,32.03165,0,0,0-32-32H32A32.03165,32.03165,0,0,0,0,144V288a32.03165,32.03165,0,0,0,32,32H64v32a32.03165,32.03165,0,0,0,32,32h32v64a32.03165,32.03165,0,0,0,32,32h80a32.03165,32.03165,0,0,0,32-32V416a32.03165,32.03165,0,0,0-32-32h96a32.03165,32.03165,0,0,0-32,32v32a32.03165,32.03165,0,0,0,32,32h80a32.03165,32.03165,0,0,0,32-32V384h32a32.03165,32.03165,0,0,0,32-32V320h32a32.03165,32.03165,0,0,0,32-32V144A32.03165,32.03165,0,0,0,544,112ZM416,64h32V96H416ZM128,96V64h32V96ZM240,448H160V384h32v32h48Zm176,0H336V416h48V384h32ZM544,288H480v64H96V288H32V144H64V256H96V192h96V96h32v64H352V96h32v96h96v64h32V144h32Z"/></svg> People usually (falsely) think the data or population need to be normally distributed ] -- ## Estimation * Normal errors don't really matter * When errors are not normally distributed, *b* will be unbiased and optimal (i.e., will minimize the variance), but there may be classes of estimator (other than OLS) that are more accurate (Wilcox, 2010) -- ## Confidence intervals and significance tests * When residuals are normal + It can be shown that the *b*s have a normal sampling distribution. + Test statistics of *b*s (usually testing the null of *b* = 0) follow a *t*-distribution. * If they are not normal then + We can't base confidence intervals on the properties of the normal distribution. + We don't know what distribution tests statistics have. --- # A Normal Distribution .center[ <!-- --> ] ??? Example of memes --- background-image: none # The Central Limit Theorem (CLT) .center[  ] --- # Exploring normality of model errors * Check the distribution of the model residuals using a P-P/Q-Q plot ## Large samples * You don't need to worry about this assumption in large samples because of the CLT ## Small samples * Use a .blue[bootstrap] to get an empirical confidence interval and standard error (more on this later ...) --- # The K-S Test You might hear about it but **don’t use it**: think about what we know about sample sizes and significance. For the avoidance of doubt, **don’t use it**. One more time ... **don’t use it** --- background-image: none background-color: #000000 class: no-scribble <video width="100%" height="100%" controls> <source src="media/shocked_cat_ks.mp4" type="video/mp4"> </video> --- .pull-left[ ### Normal residuals  ] -- .pull-right[ ### Our residuals: Non-normal  ] ??? S-shape = heavy tails Curve above line = left skew Curve below loine = right skew (which is what we have here, see earlier histogram) --- background-image: none background-color: #000000 class: no-scribble <video width="100%" height="100%" controls id="my_video"> <source src="media/normality_song.mp4" type="video/mp4"> </video> --- background-image: none background-color: #000000 class: no-scribble <video width="100%" height="100%" controls id="my_video"> <source src="media/normality_song_instrumental.mp4" type="video/mp4"> </video> --- class: center, middle, title-slide, inverse layout: false ## Part 4: Correcting problems? --- # Robust procedures ## The bootstrap * Standard errors are derived empirically using a resampling technique * Results in robust confidence intervals and *p*-values * Designed for small samples (when normality matters) -- ## Heteroskedasticity-consistent standard errors * Use a sandwich estimator * HC3 and HC4 methods work best --- background-image: none background-color: #000000 class: no-scribble <video width="100%" height="100%" controls id="my_video"> <source src="media/bootstrap_hippo.mp4" type="video/mp4"> </video> --- # The Bootstrap <table> <tbody> <tr> <td style="text-align:left;color: #82b1b0 !important;font-size: 18px;"> yield </td> <td style="text-align:right;color: #82b1b0 !important;font-size: 18px;"> 0 </td> <td style="text-align:right;color: #82b1b0 !important;font-size: 18px;"> 6 </td> <td style="text-align:right;color: #82b1b0 !important;font-size: 18px;"> 6 </td> <td style="text-align:right;color: #82b1b0 !important;font-size: 18px;"> 7 </td> <td style="text-align:right;color: #82b1b0 !important;font-size: 18px;"> 7 </td> <td style="text-align:right;color: #82b1b0 !important;font-size: 18px;"> 7 </td> <td style="text-align:right;color: #82b1b0 !important;font-size: 18px;"> 7 </td> <td style="text-align:right;color: #82b1b0 !important;font-size: 18px;"> 7 </td> <td style="text-align:right;color: #82b1b0 !important;font-size: 18px;"> 8 </td> <td style="text-align:right;color: #82b1b0 !important;font-size: 18px;"> 8 </td> <td style="text-align:right;color: #82b1b0 !important;font-size: 18px;"> 12 </td> <td style="text-align:right;color: #82b1b0 !important;font-size: 18px;"> 13 </td> <td style="text-align:right;color: #82b1b0 !important;font-size: 18px;"> 13 </td> <td style="text-align:right;color: #82b1b0 !important;font-size: 18px;"> 15 </td> <td style="text-align:right;color: #82b1b0 !important;font-size: 18px;"> 15 </td> <td style="text-align:right;color: #82b1b0 !important;font-size: 18px;"> 16 </td> <td style="text-align:right;color: #82b1b0 !important;font-size: 18px;"> 16 </td> <td style="text-align:right;color: #82b1b0 !important;font-size: 18px;"> 16 </td> <td style="text-align:right;color: #82b1b0 !important;font-size: 18px;"> 20 </td> <td style="text-align:right;color: #82b1b0 !important;font-size: 18px;"> 22 </td> <td style="text-align:right;color: #82b1b0 !important;font-size: 18px;"> 22 </td> <td style="text-align:right;color: #82b1b0 !important;font-size: 18px;"> 23 </td> <td style="text-align:right;color: #82b1b0 !important;font-size: 18px;"> 26 </td> <td style="text-align:right;color: #82b1b0 !important;font-size: 18px;"> 28 </td> <td style="text-align:right;color: #82b1b0 !important;font-size: 18px;"> 28 </td> <td style="text-align:right;color: #82b1b0 !important;font-size: 18px;"> 29 </td> <td style="text-align:right;color: #82b1b0 !important;font-size: 18px;"> 31 </td> <td style="text-align:right;color: #82b1b0 !important;font-size: 18px;"> 32 </td> <td style="text-align:right;color: #82b1b0 !important;font-size: 18px;"> 40 </td> <td style="text-align:right;color: #82b1b0 !important;font-size: 18px;"> 44 </td> <td style="text-align:right;color: #82b1b0 !important;font-size: 18px;"> 47 </td> <td style="text-align:right;color: #82b1b0 !important;font-size: 18px;"> 48 </td> <td style="text-align:right;color: #82b1b0 !important;font-size: 18px;"> 69 </td> <td style="text-align:right;color: #82b1b0 !important;font-size: 18px;"> 95 </td> </tr> </tbody> </table> .center[Mean = 23.03] -- Bootstrap sample 1: <table> <tbody> <tr> <td style="text-align:left;color: #82b1b0 !important;font-size: 18px;"> yield </td> <td style="text-align:right;color: #82b1b0 !important;font-size: 18px;"> 7 </td> <td style="text-align:right;color: #82b1b0 !important;font-size: 18px;"> 7 </td> <td style="text-align:right;color: #82b1b0 !important;font-size: 18px;"> 7 </td> <td style="text-align:right;color: #82b1b0 !important;font-size: 18px;"> 7 </td> <td style="text-align:right;color: #82b1b0 !important;font-size: 18px;"> 7 </td> <td style="text-align:right;color: #82b1b0 !important;font-size: 18px;"> 7 </td> <td style="text-align:right;color: #82b1b0 !important;font-size: 18px;"> 7 </td> <td style="text-align:right;color: #82b1b0 !important;font-size: 18px;"> 7 </td> <td style="text-align:right;color: #82b1b0 !important;font-size: 18px;"> 7 </td> <td style="text-align:right;color: #82b1b0 !important;font-size: 18px;"> 8 </td> <td style="text-align:right;color: #82b1b0 !important;font-size: 18px;"> 12 </td> <td style="text-align:right;color: #82b1b0 !important;font-size: 18px;"> 12 </td> <td style="text-align:right;color: #82b1b0 !important;font-size: 18px;"> 12 </td> <td style="text-align:right;color: #82b1b0 !important;font-size: 18px;"> 13 </td> <td style="text-align:right;color: #82b1b0 !important;font-size: 18px;"> 13 </td> <td style="text-align:right;color: #82b1b0 !important;font-size: 18px;"> 13 </td> <td style="text-align:right;color: #82b1b0 !important;font-size: 18px;"> 13 </td> <td style="text-align:right;color: #82b1b0 !important;font-size: 18px;"> 13 </td> <td style="text-align:right;color: #82b1b0 !important;font-size: 18px;"> 15 </td> <td style="text-align:right;color: #82b1b0 !important;font-size: 18px;"> 15 </td> <td style="text-align:right;color: #82b1b0 !important;font-size: 18px;"> 16 </td> <td style="text-align:right;color: #82b1b0 !important;font-size: 18px;"> 16 </td> <td style="text-align:right;color: #82b1b0 !important;font-size: 18px;"> 22 </td> <td style="text-align:right;color: #82b1b0 !important;font-size: 18px;"> 22 </td> <td style="text-align:right;color: #82b1b0 !important;font-size: 18px;"> 23 </td> <td style="text-align:right;color: #82b1b0 !important;font-size: 18px;"> 26 </td> <td style="text-align:right;color: #82b1b0 !important;font-size: 18px;"> 28 </td> <td style="text-align:right;color: #82b1b0 !important;font-size: 18px;"> 28 </td> <td style="text-align:right;color: #82b1b0 !important;font-size: 18px;"> 32 </td> <td style="text-align:right;color: #82b1b0 !important;font-size: 18px;"> 40 </td> <td style="text-align:right;color: #82b1b0 !important;font-size: 18px;"> 44 </td> <td style="text-align:right;color: #82b1b0 !important;font-size: 18px;"> 44 </td> <td style="text-align:right;color: #82b1b0 !important;font-size: 18px;"> 48 </td> <td style="text-align:right;color: #82b1b0 !important;font-size: 18px;"> 69 </td> </tr> </tbody> </table> .center[Mean = 19.41] -- Bootstrap sample 2: <table> <tbody> <tr> <td style="text-align:left;color: #82b1b0 !important;font-size: 18px;"> yield </td> <td style="text-align:right;color: #82b1b0 !important;font-size: 18px;"> 0 </td> <td style="text-align:right;color: #82b1b0 !important;font-size: 18px;"> 6 </td> <td style="text-align:right;color: #82b1b0 !important;font-size: 18px;"> 7 </td> <td style="text-align:right;color: #82b1b0 !important;font-size: 18px;"> 7 </td> <td style="text-align:right;color: #82b1b0 !important;font-size: 18px;"> 7 </td> <td style="text-align:right;color: #82b1b0 !important;font-size: 18px;"> 7 </td> <td style="text-align:right;color: #82b1b0 !important;font-size: 18px;"> 7 </td> <td style="text-align:right;color: #82b1b0 !important;font-size: 18px;"> 7 </td> <td style="text-align:right;color: #82b1b0 !important;font-size: 18px;"> 7 </td> <td style="text-align:right;color: #82b1b0 !important;font-size: 18px;"> 8 </td> <td style="text-align:right;color: #82b1b0 !important;font-size: 18px;"> 13 </td> <td style="text-align:right;color: #82b1b0 !important;font-size: 18px;"> 13 </td> <td style="text-align:right;color: #82b1b0 !important;font-size: 18px;"> 13 </td> <td style="text-align:right;color: #82b1b0 !important;font-size: 18px;"> 13 </td> <td style="text-align:right;color: #82b1b0 !important;font-size: 18px;"> 15 </td> <td style="text-align:right;color: #82b1b0 !important;font-size: 18px;"> 15 </td> <td style="text-align:right;color: #82b1b0 !important;font-size: 18px;"> 16 </td> <td style="text-align:right;color: #82b1b0 !important;font-size: 18px;"> 20 </td> <td style="text-align:right;color: #82b1b0 !important;font-size: 18px;"> 20 </td> <td style="text-align:right;color: #82b1b0 !important;font-size: 18px;"> 22 </td> <td style="text-align:right;color: #82b1b0 !important;font-size: 18px;"> 22 </td> <td style="text-align:right;color: #82b1b0 !important;font-size: 18px;"> 23 </td> <td style="text-align:right;color: #82b1b0 !important;font-size: 18px;"> 23 </td> <td style="text-align:right;color: #82b1b0 !important;font-size: 18px;"> 28 </td> <td style="text-align:right;color: #82b1b0 !important;font-size: 18px;"> 28 </td> <td style="text-align:right;color: #82b1b0 !important;font-size: 18px;"> 28 </td> <td style="text-align:right;color: #82b1b0 !important;font-size: 18px;"> 29 </td> <td style="text-align:right;color: #82b1b0 !important;font-size: 18px;"> 29 </td> <td style="text-align:right;color: #82b1b0 !important;font-size: 18px;"> 31 </td> <td style="text-align:right;color: #82b1b0 !important;font-size: 18px;"> 44 </td> <td style="text-align:right;color: #82b1b0 !important;font-size: 18px;"> 44 </td> <td style="text-align:right;color: #82b1b0 !important;font-size: 18px;"> 48 </td> <td style="text-align:right;color: #82b1b0 !important;font-size: 18px;"> 48 </td> <td style="text-align:right;color: #82b1b0 !important;font-size: 18px;"> 48 </td> </tr> </tbody> </table> .center[Mean = 20.47] --- <table> <tbody> <tr> <td style="text-align:left;color: #82b1b0 !important;font-size: 18px;"> yield </td> <td style="text-align:right;color: #82b1b0 !important;font-size: 18px;"> 0 </td> <td style="text-align:right;color: #82b1b0 !important;font-size: 18px;"> 6 </td> <td style="text-align:right;color: #82b1b0 !important;font-size: 18px;"> 6 </td> <td style="text-align:right;color: #82b1b0 !important;font-size: 18px;"> 7 </td> <td style="text-align:right;color: #82b1b0 !important;font-size: 18px;"> 7 </td> <td style="text-align:right;color: #82b1b0 !important;font-size: 18px;"> 7 </td> <td style="text-align:right;color: #82b1b0 !important;font-size: 18px;"> 7 </td> <td style="text-align:right;color: #82b1b0 !important;font-size: 18px;"> 7 </td> <td style="text-align:right;color: #82b1b0 !important;font-size: 18px;"> 8 </td> <td style="text-align:right;color: #82b1b0 !important;font-size: 18px;"> 8 </td> <td style="text-align:right;color: #82b1b0 !important;font-size: 18px;"> 12 </td> <td style="text-align:right;color: #82b1b0 !important;font-size: 18px;"> 13 </td> <td style="text-align:right;color: #82b1b0 !important;font-size: 18px;"> 13 </td> <td style="text-align:right;color: #82b1b0 !important;font-size: 18px;"> 15 </td> <td style="text-align:right;color: #82b1b0 !important;font-size: 18px;"> 15 </td> <td style="text-align:right;color: #82b1b0 !important;font-size: 18px;"> 16 </td> <td style="text-align:right;color: #82b1b0 !important;font-size: 18px;"> 16 </td> <td style="text-align:right;color: #82b1b0 !important;font-size: 18px;"> 16 </td> <td style="text-align:right;color: #82b1b0 !important;font-size: 18px;"> 20 </td> <td style="text-align:right;color: #82b1b0 !important;font-size: 18px;"> 22 </td> <td style="text-align:right;color: #82b1b0 !important;font-size: 18px;"> 22 </td> <td style="text-align:right;color: #82b1b0 !important;font-size: 18px;"> 23 </td> <td style="text-align:right;color: #82b1b0 !important;font-size: 18px;"> 26 </td> <td style="text-align:right;color: #82b1b0 !important;font-size: 18px;"> 28 </td> <td style="text-align:right;color: #82b1b0 !important;font-size: 18px;"> 28 </td> <td style="text-align:right;color: #82b1b0 !important;font-size: 18px;"> 29 </td> <td style="text-align:right;color: #82b1b0 !important;font-size: 18px;"> 31 </td> <td style="text-align:right;color: #82b1b0 !important;font-size: 18px;"> 32 </td> <td style="text-align:right;color: #82b1b0 !important;font-size: 18px;"> 40 </td> <td style="text-align:right;color: #82b1b0 !important;font-size: 18px;"> 44 </td> <td style="text-align:right;color: #82b1b0 !important;font-size: 18px;"> 47 </td> <td style="text-align:right;color: #82b1b0 !important;font-size: 18px;"> 48 </td> <td style="text-align:right;color: #82b1b0 !important;font-size: 18px;"> 69 </td> <td style="text-align:right;color: #82b1b0 !important;font-size: 18px;"> 95 </td> </tr> </tbody> </table> -- .center[  ] --- <table> <tbody> <tr> <td style="text-align:left;color: #82b1b0 !important;font-size: 18px;"> yield </td> <td style="text-align:right;color: #82b1b0 !important;font-size: 18px;"> 0 </td> <td style="text-align:right;color: #82b1b0 !important;font-size: 18px;"> 6 </td> <td style="text-align:right;color: #82b1b0 !important;font-size: 18px;"> 6 </td> <td style="text-align:right;color: #82b1b0 !important;font-size: 18px;"> 7 </td> <td style="text-align:right;color: #82b1b0 !important;font-size: 18px;"> 7 </td> <td style="text-align:right;color: #82b1b0 !important;font-size: 18px;"> 7 </td> <td style="text-align:right;color: #82b1b0 !important;font-size: 18px;"> 7 </td> <td style="text-align:right;color: #82b1b0 !important;font-size: 18px;"> 7 </td> <td style="text-align:right;color: #82b1b0 !important;font-size: 18px;"> 8 </td> <td style="text-align:right;color: #82b1b0 !important;font-size: 18px;"> 8 </td> <td style="text-align:right;color: #82b1b0 !important;font-size: 18px;"> 12 </td> <td style="text-align:right;color: #82b1b0 !important;font-size: 18px;"> 13 </td> <td style="text-align:right;color: #82b1b0 !important;font-size: 18px;"> 13 </td> <td style="text-align:right;color: #82b1b0 !important;font-size: 18px;"> 15 </td> <td style="text-align:right;color: #82b1b0 !important;font-size: 18px;"> 15 </td> <td style="text-align:right;color: #82b1b0 !important;font-size: 18px;"> 16 </td> <td style="text-align:right;color: #82b1b0 !important;font-size: 18px;"> 16 </td> <td style="text-align:right;color: #82b1b0 !important;font-size: 18px;"> 16 </td> <td style="text-align:right;color: #82b1b0 !important;font-size: 18px;"> 20 </td> <td style="text-align:right;color: #82b1b0 !important;font-size: 18px;"> 22 </td> <td style="text-align:right;color: #82b1b0 !important;font-size: 18px;"> 22 </td> <td style="text-align:right;color: #82b1b0 !important;font-size: 18px;"> 23 </td> <td style="text-align:right;color: #82b1b0 !important;font-size: 18px;"> 26 </td> <td style="text-align:right;color: #82b1b0 !important;font-size: 18px;"> 28 </td> <td style="text-align:right;color: #82b1b0 !important;font-size: 18px;"> 28 </td> <td style="text-align:right;color: #82b1b0 !important;font-size: 18px;"> 29 </td> <td style="text-align:right;color: #82b1b0 !important;font-size: 18px;"> 31 </td> <td style="text-align:right;color: #82b1b0 !important;font-size: 18px;"> 32 </td> <td style="text-align:right;color: #82b1b0 !important;font-size: 18px;"> 40 </td> <td style="text-align:right;color: #82b1b0 !important;font-size: 18px;"> 44 </td> <td style="text-align:right;color: #82b1b0 !important;font-size: 18px;"> 47 </td> <td style="text-align:right;color: #82b1b0 !important;font-size: 18px;"> 48 </td> <td style="text-align:right;color: #82b1b0 !important;font-size: 18px;"> 69 </td> <td style="text-align:right;color: #82b1b0 !important;font-size: 18px;"> 95 </td> </tr> </tbody> </table> .center[  ] ??? next slide - video of dragon chase. --- background-image: none background-color: #000000 class: no-scribble <video width="100%" height="100%" controls id="my_video"> <source src="media/zach_chops_arlos_tail.mp4" type="video/mp4"> </video> ??? Oh deary me, I must hurry up .... --- background-image: none # Do dragons really kidnap royalty? .center[ ## Normal model (number of dragons) ```r kidnap_lm <- lm(royalty ~ dragons,data = hov_cont_tib) broom::tidy(kidnap_lm, conf.int = T) ``` <table> <thead> <tr> <th style="text-align:left;"> term </th> <th style="text-align:right;"> estimate </th> <th style="text-align:right;"> std.error </th> <th style="text-align:right;"> statistic </th> <th style="text-align:right;"> p.value </th> <th style="text-align:right;"> conf.low </th> <th style="text-align:right;"> conf.high </th> </tr> </thead> <tbody> <tr> <td style="text-align:left;"> (Intercept) </td> <td style="text-align:right;"> 3.976 </td> <td style="text-align:right;"> 0.298 </td> <td style="text-align:right;"> 13.323 </td> <td style="text-align:right;"> 0.00 </td> <td style="text-align:right;"> 3.385 </td> <td style="text-align:right;"> 4.566 </td> </tr> <tr> <td style="text-align:left;"> dragons </td> <td style="text-align:right;"> 0.116 </td> <td style="text-align:right;"> 0.056 </td> <td style="text-align:right;"> 2.074 </td> <td style="text-align:right;"> 0.04 </td> <td style="text-align:right;"> 0.005 </td> <td style="text-align:right;"> 0.226 </td> </tr> </tbody> </table> ] -- .center[ ## Robust model (number of dragons) HC4 Standard errors ```r kidnap_lm <- lm(royalty ~ dragons,data = hov_cont_tib) parameters::parameters(kidnap_lm, robust = TRUE, vcov.type = "HC4") ``` <table> <thead> <tr> <th style="text-align:left;"> Parameter </th> <th style="text-align:right;"> Coefficient </th> <th style="text-align:right;"> SE </th> <th style="text-align:right;"> CI </th> <th style="text-align:right;"> CI_low </th> <th style="text-align:right;"> CI_high </th> <th style="text-align:right;"> t </th> <th style="text-align:right;"> df_error </th> <th style="text-align:right;"> p </th> </tr> </thead> <tbody> <tr> <td style="text-align:left;"> (Intercept) </td> <td style="text-align:right;"> 3.976 </td> <td style="text-align:right;"> 0.242 </td> <td style="text-align:right;"> 0.95 </td> <td style="text-align:right;"> 3.497 </td> <td style="text-align:right;"> 4.455 </td> <td style="text-align:right;"> 16.427 </td> <td style="text-align:right;"> 128 </td> <td style="text-align:right;"> 0.000 </td> </tr> <tr> <td style="text-align:left;"> dragons </td> <td style="text-align:right;"> 0.116 </td> <td style="text-align:right;"> 0.064 </td> <td style="text-align:right;"> 0.95 </td> <td style="text-align:right;"> -0.011 </td> <td style="text-align:right;"> 0.243 </td> <td style="text-align:right;"> 1.805 </td> <td style="text-align:right;"> 128 </td> <td style="text-align:right;"> 0.073 </td> </tr> </tbody> </table> ] ??? When we fit a robust model there's no sig relationship between the number of dragons and how many royalty are kidnapped. (Note the (small) *b* doesn't change - only the *p* and CIs) --- .center[ ## Normal model (dragons or not) ```r kidnap_gp_lm <- lm(royalty ~ dragons, data = hov_cat_tib) broom::tidy(kidnap_gp_lm, conf.int = T) ``` <table> <thead> <tr> <th style="text-align:left;"> term </th> <th style="text-align:right;"> estimate </th> <th style="text-align:right;"> std.error </th> <th style="text-align:right;"> statistic </th> <th style="text-align:right;"> p.value </th> <th style="text-align:right;"> conf.low </th> <th style="text-align:right;"> conf.high </th> </tr> </thead> <tbody> <tr> <td style="text-align:left;"> (Intercept) </td> <td style="text-align:right;"> 4.257 </td> <td style="text-align:right;"> 0.414 </td> <td style="text-align:right;"> 10.281 </td> <td style="text-align:right;"> 0.000 </td> <td style="text-align:right;"> 3.434 </td> <td style="text-align:right;"> 5.080 </td> </tr> <tr> <td style="text-align:left;"> dragonsDragons </td> <td style="text-align:right;"> 1.206 </td> <td style="text-align:right;"> 0.532 </td> <td style="text-align:right;"> 2.268 </td> <td style="text-align:right;"> 0.026 </td> <td style="text-align:right;"> 0.149 </td> <td style="text-align:right;"> 2.262 </td> </tr> </tbody> </table> ] -- .center[ ## Robust model (dragons or not) HC4 standard errors ```r kidnap_gp_lm <- lm(royalty ~ dragons, data = hov_cat_tib) parameters::parameters(kidnap_gp_lm, robust = TRUE, vcov.type = "HC4") ``` <table> <thead> <tr> <th style="text-align:left;"> Parameter </th> <th style="text-align:right;"> Coefficient </th> <th style="text-align:right;"> SE </th> <th style="text-align:right;"> CI </th> <th style="text-align:right;"> CI_low </th> <th style="text-align:right;"> CI_high </th> <th style="text-align:right;"> t </th> <th style="text-align:right;"> df_error </th> <th style="text-align:right;"> p </th> </tr> </thead> <tbody> <tr> <td style="text-align:left;"> (Intercept) </td> <td style="text-align:right;"> 4.257 </td> <td style="text-align:right;"> 0.574 </td> <td style="text-align:right;"> 0.95 </td> <td style="text-align:right;"> 3.117 </td> <td style="text-align:right;"> 5.398 </td> <td style="text-align:right;"> 7.418 </td> <td style="text-align:right;"> 87 </td> <td style="text-align:right;"> 0.000 </td> </tr> <tr> <td style="text-align:left;"> dragonsDragons </td> <td style="text-align:right;"> 1.206 </td> <td style="text-align:right;"> 0.616 </td> <td style="text-align:right;"> 0.95 </td> <td style="text-align:right;"> -0.019 </td> <td style="text-align:right;"> 2.431 </td> <td style="text-align:right;"> 1.957 </td> <td style="text-align:right;"> 87 </td> <td style="text-align:right;"> 0.054 </td> </tr> </tbody> </table> ] ??? When we fit a robust model there's no sig relationship between the number of dragons and how many royalty are kidnapped. (Note the (small) *b* doesn't change - only the *p* and CIs) --- background-image: none # Does dragon poo kill crops? .center[ ## Normal model ```r poop_lm <- lm(yield ~ poop, data = poop_tib) broom::tidy(poop_lm, conf.int = T) ``` <table> <thead> <tr> <th style="text-align:left;"> term </th> <th style="text-align:right;"> estimate </th> <th style="text-align:right;"> std.error </th> <th style="text-align:right;"> statistic </th> <th style="text-align:right;"> p.value </th> <th style="text-align:right;"> conf.low </th> <th style="text-align:right;"> conf.high </th> </tr> </thead> <tbody> <tr> <td style="text-align:left;"> (Intercept) </td> <td style="text-align:right;"> 14.343 </td> <td style="text-align:right;"> 6.765 </td> <td style="text-align:right;"> 2.120 </td> <td style="text-align:right;"> 0.042 </td> <td style="text-align:right;"> 0.563 </td> <td style="text-align:right;"> 28.124 </td> </tr> <tr> <td style="text-align:left;"> poop </td> <td style="text-align:right;"> 2.023 </td> <td style="text-align:right;"> 1.371 </td> <td style="text-align:right;"> 1.476 </td> <td style="text-align:right;"> 0.150 </td> <td style="text-align:right;"> -0.770 </td> <td style="text-align:right;"> 4.815 </td> </tr> </tbody> </table> ] -- .center[ ## Bootstrap model ```r poop_lm <- lm(yield ~ poop, data = poop_tib) parameters::parameters(poop_lm, bootstrap = TRUE) ``` <table> <thead> <tr> <th style="text-align:left;"> Parameter </th> <th style="text-align:right;"> Coefficient </th> <th style="text-align:right;"> CI </th> <th style="text-align:right;"> CI_low </th> <th style="text-align:right;"> CI_high </th> <th style="text-align:right;"> p </th> </tr> </thead> <tbody> <tr> <td style="text-align:left;"> (Intercept) </td> <td style="text-align:right;"> 14.144 </td> <td style="text-align:right;"> 0.95 </td> <td style="text-align:right;"> 5.117 </td> <td style="text-align:right;"> 25.920 </td> <td style="text-align:right;"> 0.002 </td> </tr> <tr> <td style="text-align:left;"> poop </td> <td style="text-align:right;"> 2.058 </td> <td style="text-align:right;"> 0.95 </td> <td style="text-align:right;"> 0.086 </td> <td style="text-align:right;"> 3.919 </td> <td style="text-align:right;"> 0.046 </td> </tr> </tbody> </table> ] ??? When we fit a robust model there is a sig relationship between the quantity of dragon poop and the yield of crops. (Note a 2% increase in yield per extra dragon, so with only 5 additional dragons Yield will improve by 10%) --- background-image: none background-color: #000000 class: no-scribble <video width="100%" height="100%" controls id="my_video"> <source src="media/arlo_have_you_saved_the_dragons_yet_2_caption.mp4" type="video/mp4"> </video> ??? I think I might just have ... --- background-image: none background-color: #000000 class: no-scribble <video width="100%" height="100%" controls id="my_video"> <source src="media/zach_not_allowed_to_kill_dragons_caption.mp4" type="video/mp4"> </video> ??? No, no more dragon slaying because I'm afraid you've been misled. When you remove the ogres, there's no significant association between the presence of dragons and sheep being eaten. Also, when you fit robust models there's no significant association between the presence of dragons and royalty going missing, but dragon poo does significantly improve crop yield. Your rulers have been feeding you, well ... lies ... CLICK VIDEO --- background-image: none background-color: #000000 class: no-scribble <video width="100%" height="100%" controls id="my_video"> <source src="media/zach_what_can_i_kill_caption.mp4" type="video/mp4"> </video> ??? Maybe the rulers statisticians? But really, it's not nice to kill anyone, so maybe we should all have a nice cup of tea ... CLICK VIDEO --- background-image: none background-color: #000000 class: no-scribble <video width="100%" height="100%" controls id="my_video"> <source src="media/zach_kill_you_caption.mp4" type="video/mp4"> </video> ??? CLICK VIDEO and run screaming from lecture theatre --- ## Summary The key assumptions of the General Linear Model and what they affect are (in order of importance) * Linearity and additivity + If you don’t have these then you’re fitting the wrong model in the first place * Spherical errors (homoscedastic and independent errors). When violated: + *b* s are unbiased but not optimal + Standard error of parameter, associated *t*-test, *p*-value and confidence intervals will be incorrect * Normality of residuals and sampling distribution + Normality of errors doesn’t *really* matter + Normality of sampling distribution matters for *p*-values and confidence intervals associated with the *b*s of the model. + Central limit theorem! * Pay attention to outliers and influential cases + Standardized residuals + Cook’s distance (absolute value > 1) * Robust methods + Bootstrapping + Use robust SEs